Email Deliverability Metrics
Deliverability metrics are data metrics of the process from when an email is sent, to when the email is opened or an embedded link is clicked.
Overview of basic deliverability metrics
You may view data reports containing the basic deliverability metrics of campaigns in 2 ways:
- In the SmartLink navigation bar,select Email, then select Regular under Campaigns, and click View report in the Action column of an ended campaign.
- In the SmartLink navigation bar,select Email, then select campaign reports under Analytics, and click on View report in the Action column of a campaign.
A data report consists of the following sections:
1. Delivery metrics
The overall performance metrics from the launch of a campaign, without specifying a date range or any filtering options.
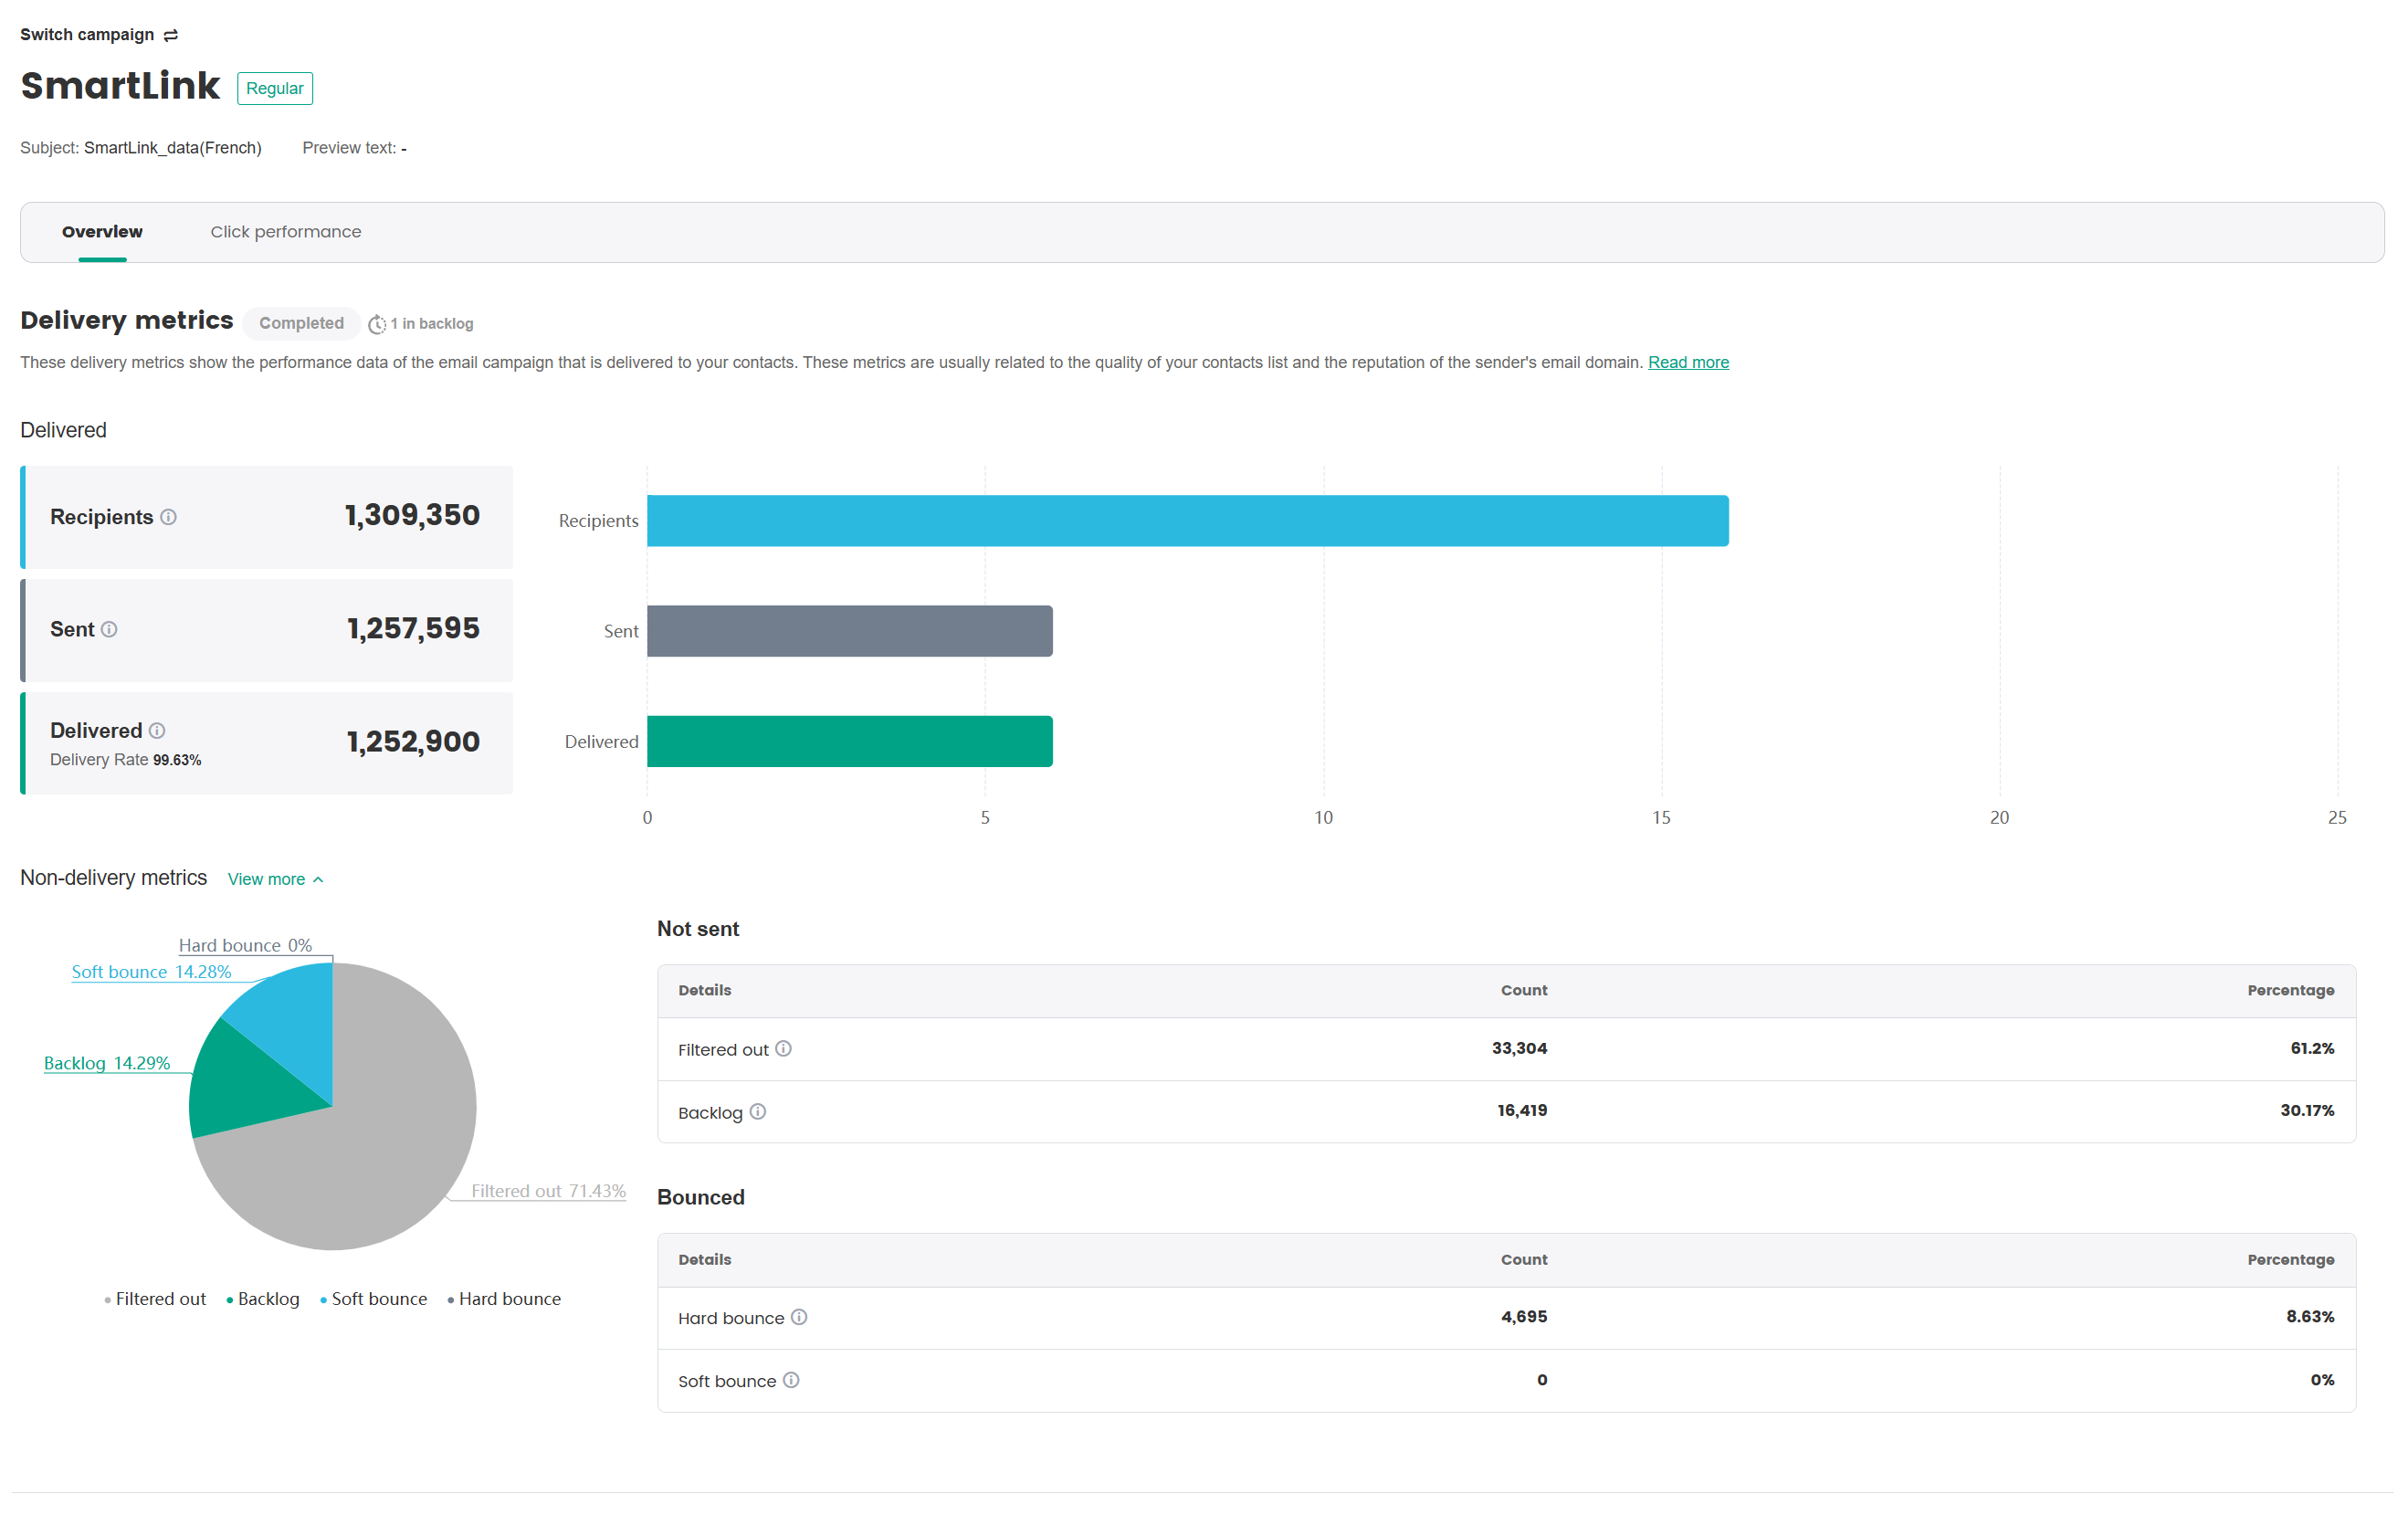
| Metric Name | Metric Definition |
|---|---|
| Recipients | Total contacts in a campaign |
| Sent | Total emails sent in a campaign |
| Delivered | Total emails that reached the recipient's mailbox |
| Delivery rate | Delivered / Sent |
| Filtered | Total email addresses filtered out before delivery (by blocklist or other mechanisms) |
| Backlog | Total emails waiting to be resent as a result of system or server delays |
| Hard bounce | Total permanent undelivered emails due to invalid or non-existent email addresses |
| Soft bounce | Total temporarily undelivered emails due to a full mailbox or temporarily unavailable server |
2. Email engagement
These metrics reflect whether your email/campaign content had appealed to your audience.
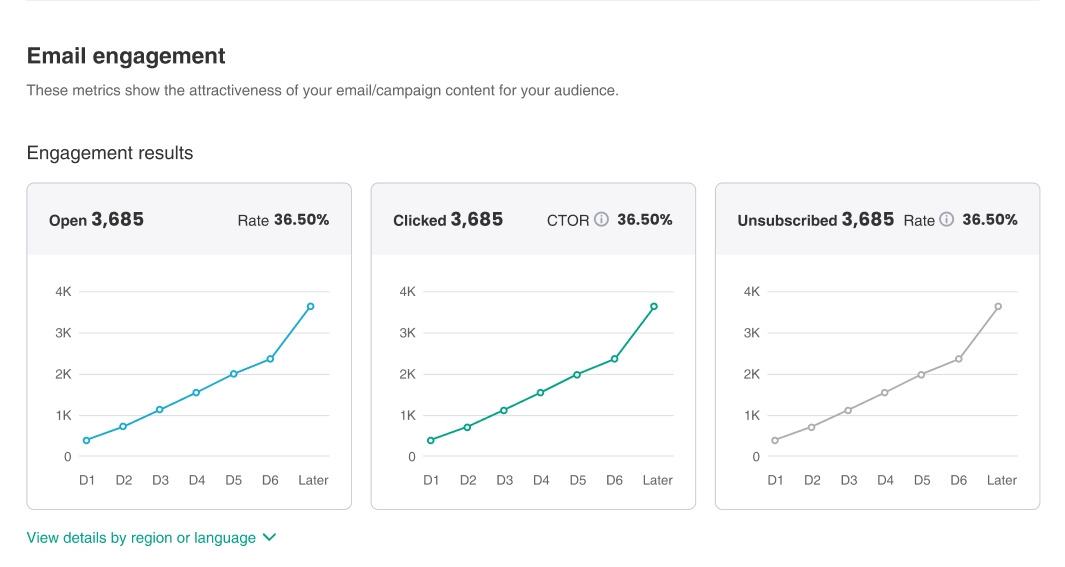
| Metric Name | Metric Definition |
|---|---|
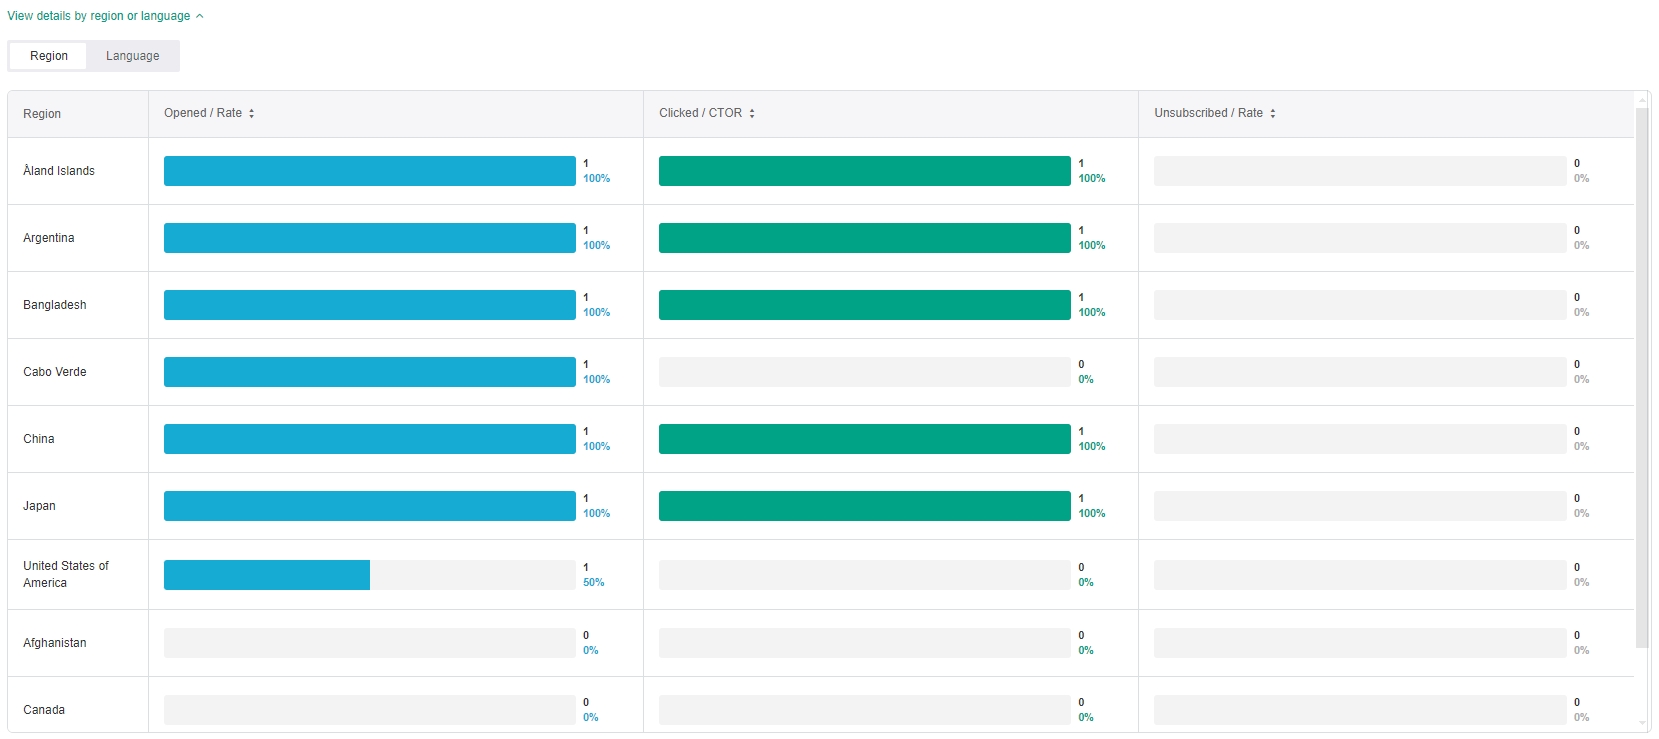
| Opened | Total recipients who opened your email at least once |
| Open rate | Opened / Delivered |
| Clicked | Total recipients who clicked a link in your email at least once |
| Click-to-open rate (CTOR) | Clicked / Opened |
| Unsubscribed | Total recipients who unsubscribed from your email |
| Unsubscribe rate | Unsubscribed / Opened |
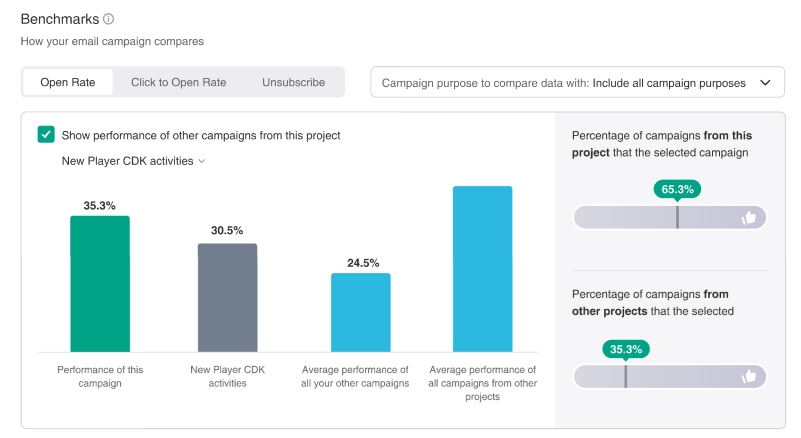
The current campaign can be compared with data from other similar campaigns, to give you a deeper understanding of the campaign's overall performance. You may select any previous campaign within your project for the comparison.
To view data by region or language, click View details by region or language to expand the section for more details.
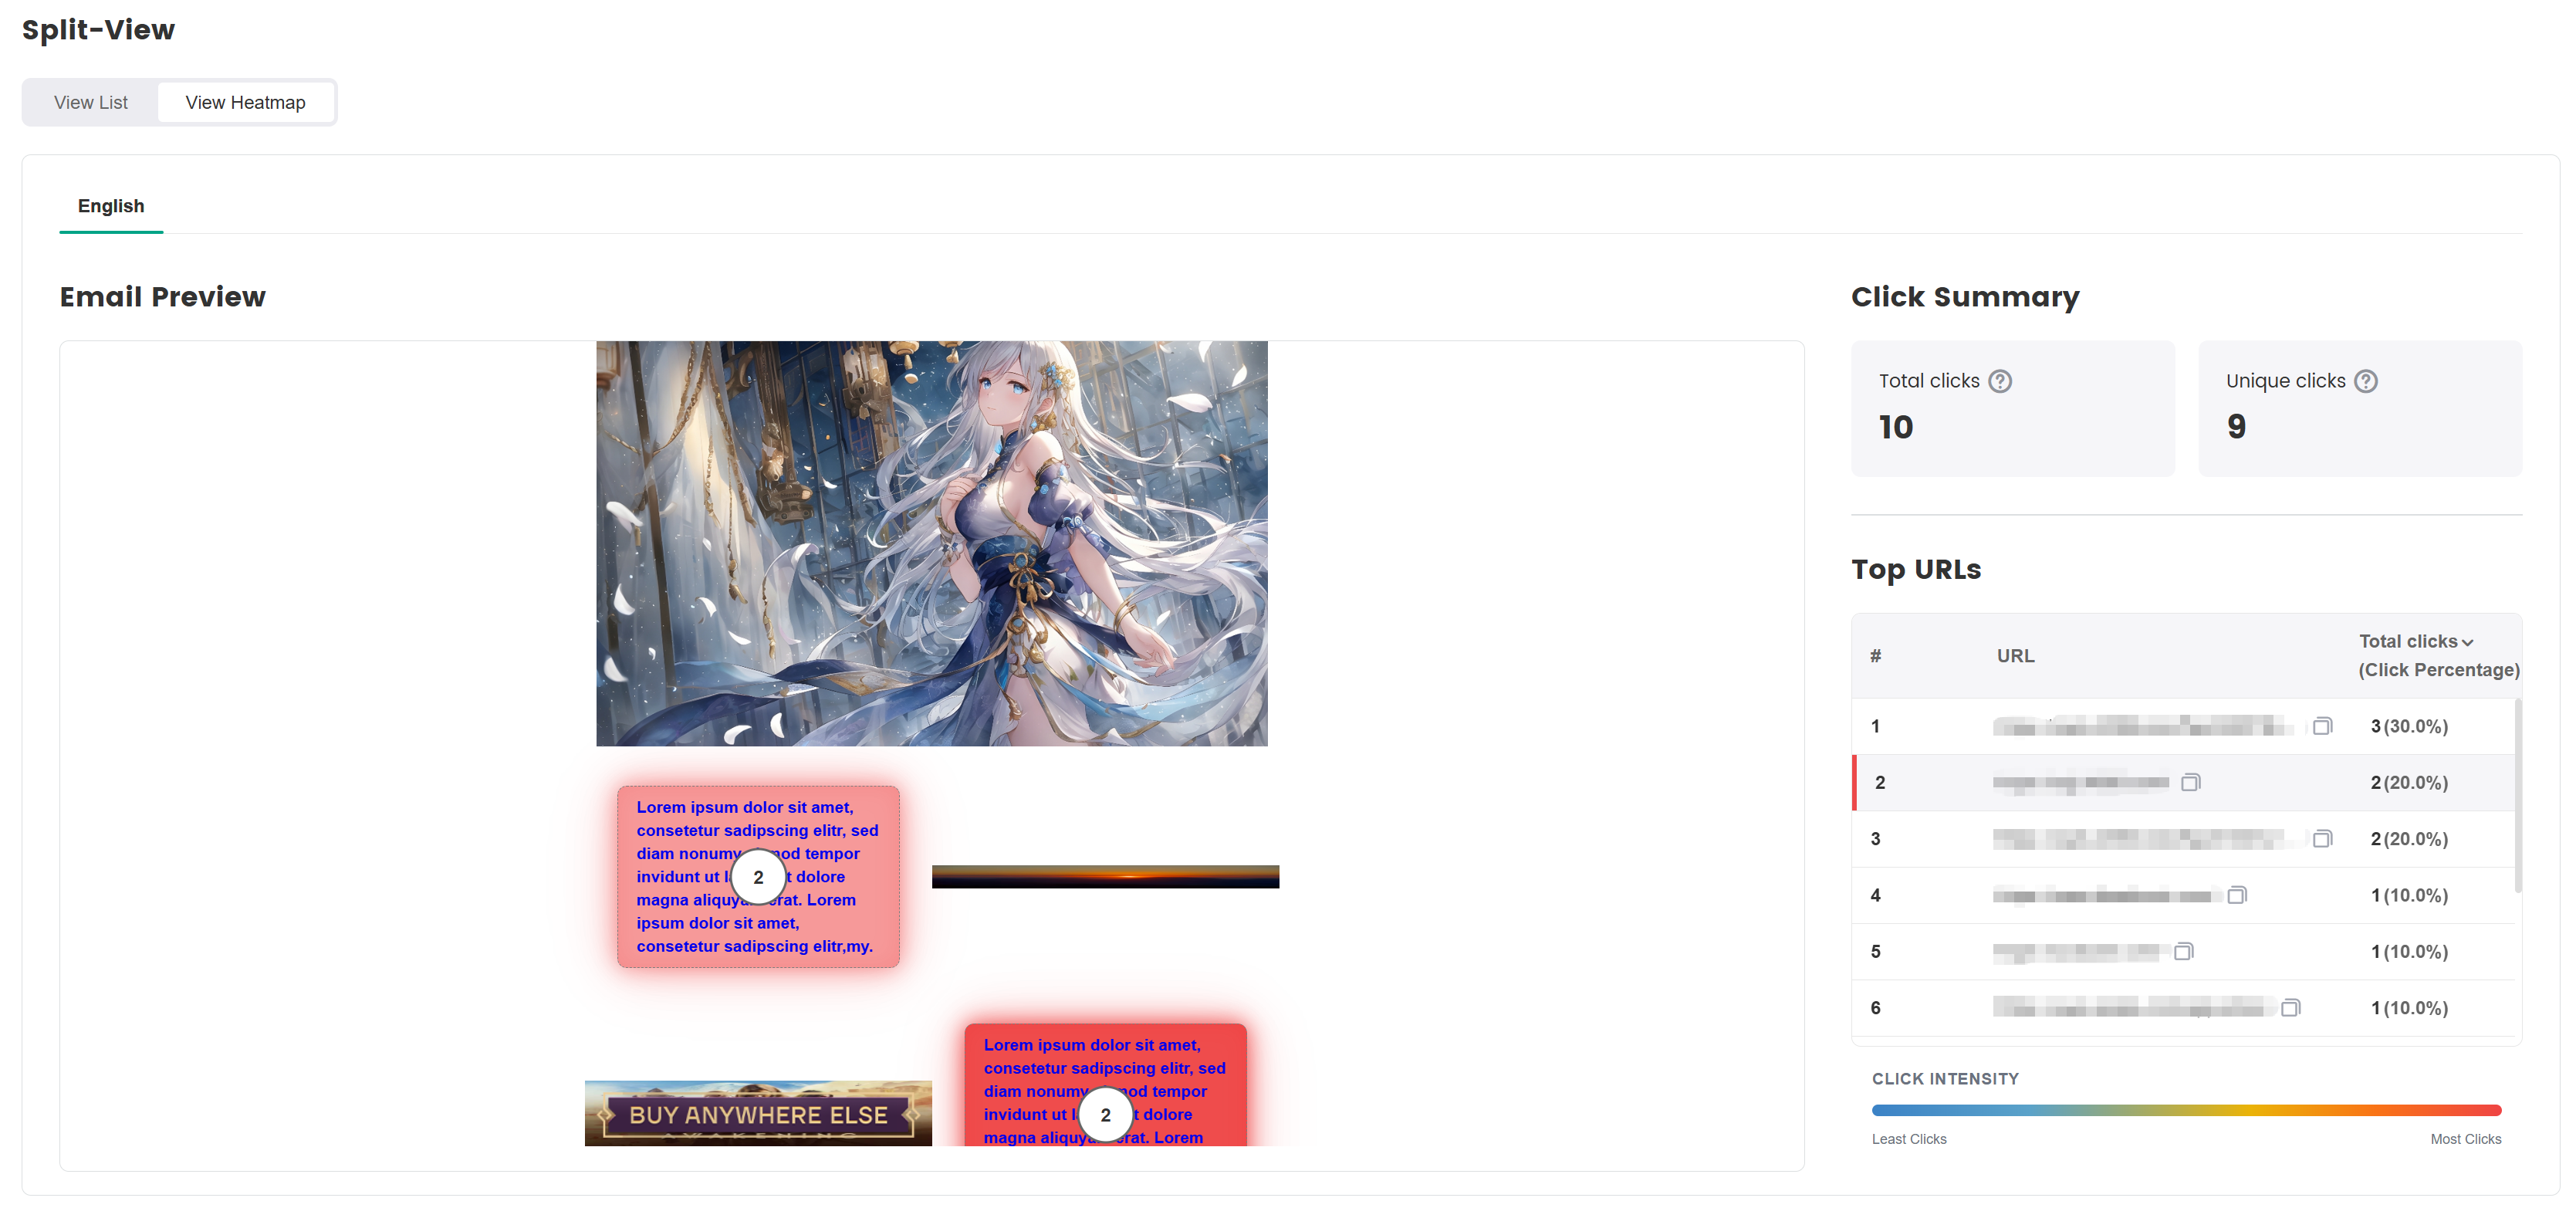
3. Click summary
SmartLink provides in-depth data analyses, showing the click count and click rate of links to better understand a campaign's performance and effectiveness.
From a data report, click Click performance to see the campaign's click-to-open rate.
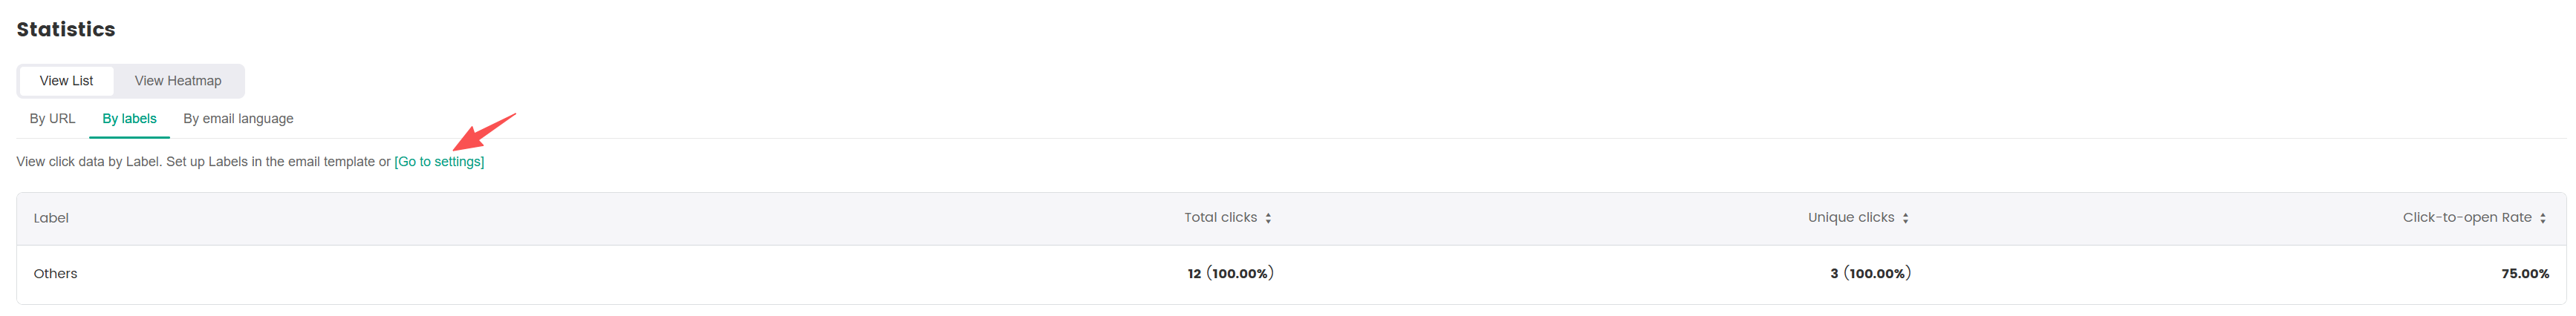
Click Expand unique URL, By labels, or By email language to sort the statistics accordingly.
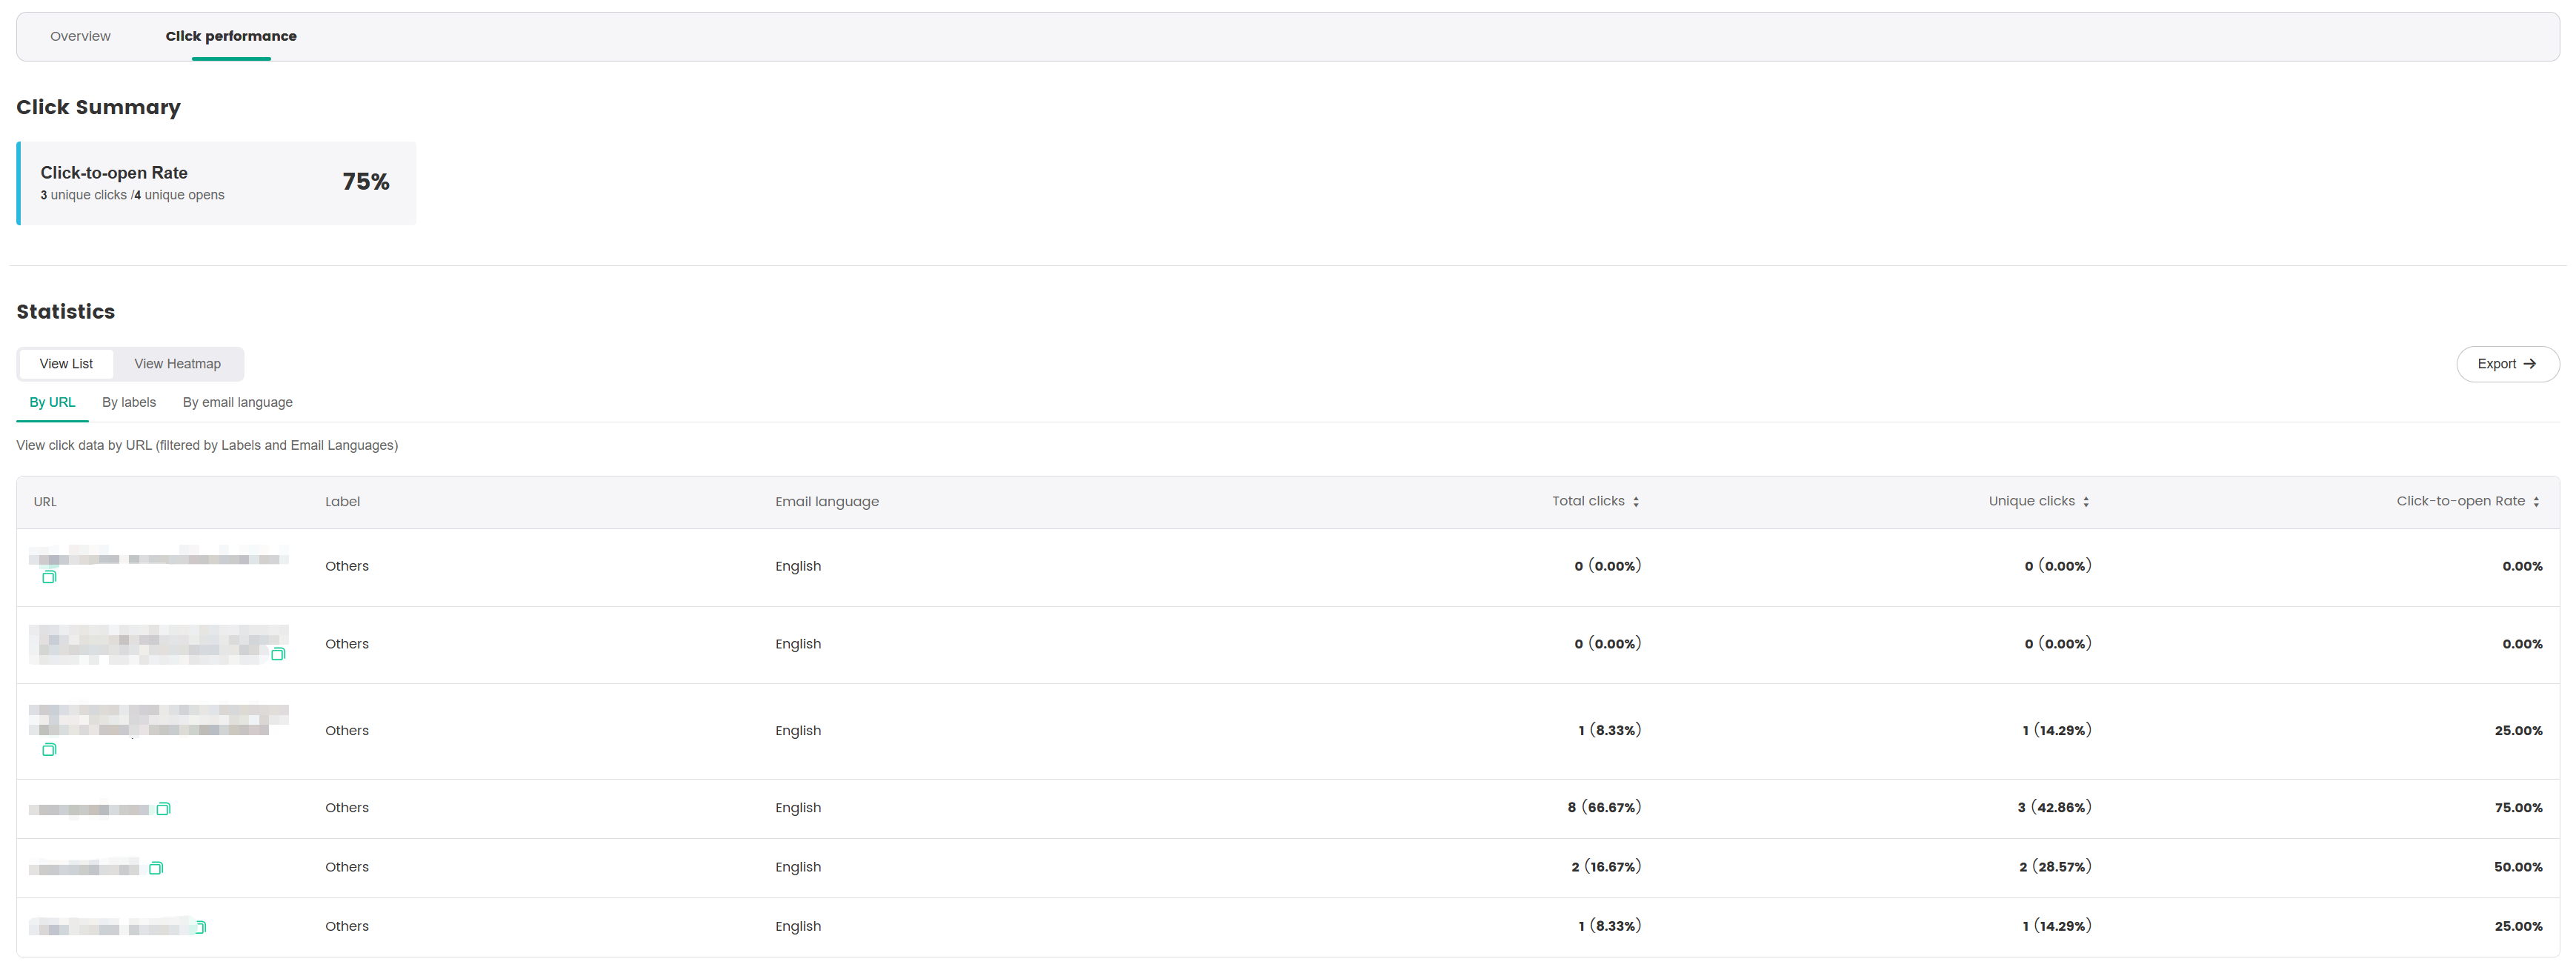
Owners can export user click details to view the click frequency and timing of specific email addresses.

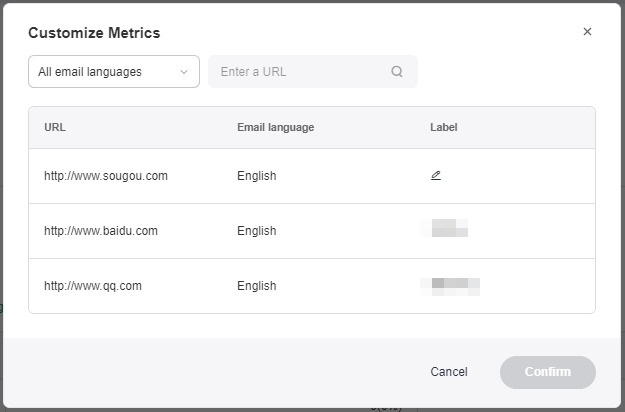
- To edit the labels of different URLs, click Go to settings from the By labels tab to make it easier to view specific data.
| Category | Metric Name | Metric Definition |
|---|---|---|
| Click by URL | Total URL clicks | Total number of clicks on a link in an email |
| Unique URL clicks | Total number of unique clicks on a link in an email | |
| URL click rate | Unique URL clicks / Total emails opened that contain this link | |
| Click by label | Total label clicks | Total number of clicks on any link grouped under that label |
| Unique label clicks | Total number of unique clicks on any link grouped under that label | |
| Label click rate | Unique label clicks / Total emails opened that contain this label | |
| Click by language | Total language clicks | Total number of clicks on a link for each recipients' language |
| Unique language clicks | Total number of unique clicks on a link for each recipients' language | |
| Language click rate | Unique language clicks / Total emails opened by this language's recipients |
- SmartLink's data reports also feature a built-in click heatmap for campaigns. It intuitively displays the distribution of page clicks through color shading, helping you quickly identify hotspot areas and improve the efficiency of campaign review and analysis.